COVID-19_SQL_Tableau_Dashboard
| Tableau Dashboard Link | GitHub Repository Link |
Introduction
Timeframe of Analysis in [DD/MM/YYYY]: From 01/01/2020 to 06/07/2023
This project focuses on visualizing COVID-19 infection and death data using Tableau. It aims to provide a visual representation of the detrimental impact of COVID-19 on a global scale & within the SEA region.
The dataset used in this analysis is obtained from ‘Our World in Data’
Tableau Dashboard
The Tableau Dashboard created for this project can be found in the link below:
Tableau Dashboard Link


Features present in Dashboard
Both pages present within the Tableau storyboard contains the features below:
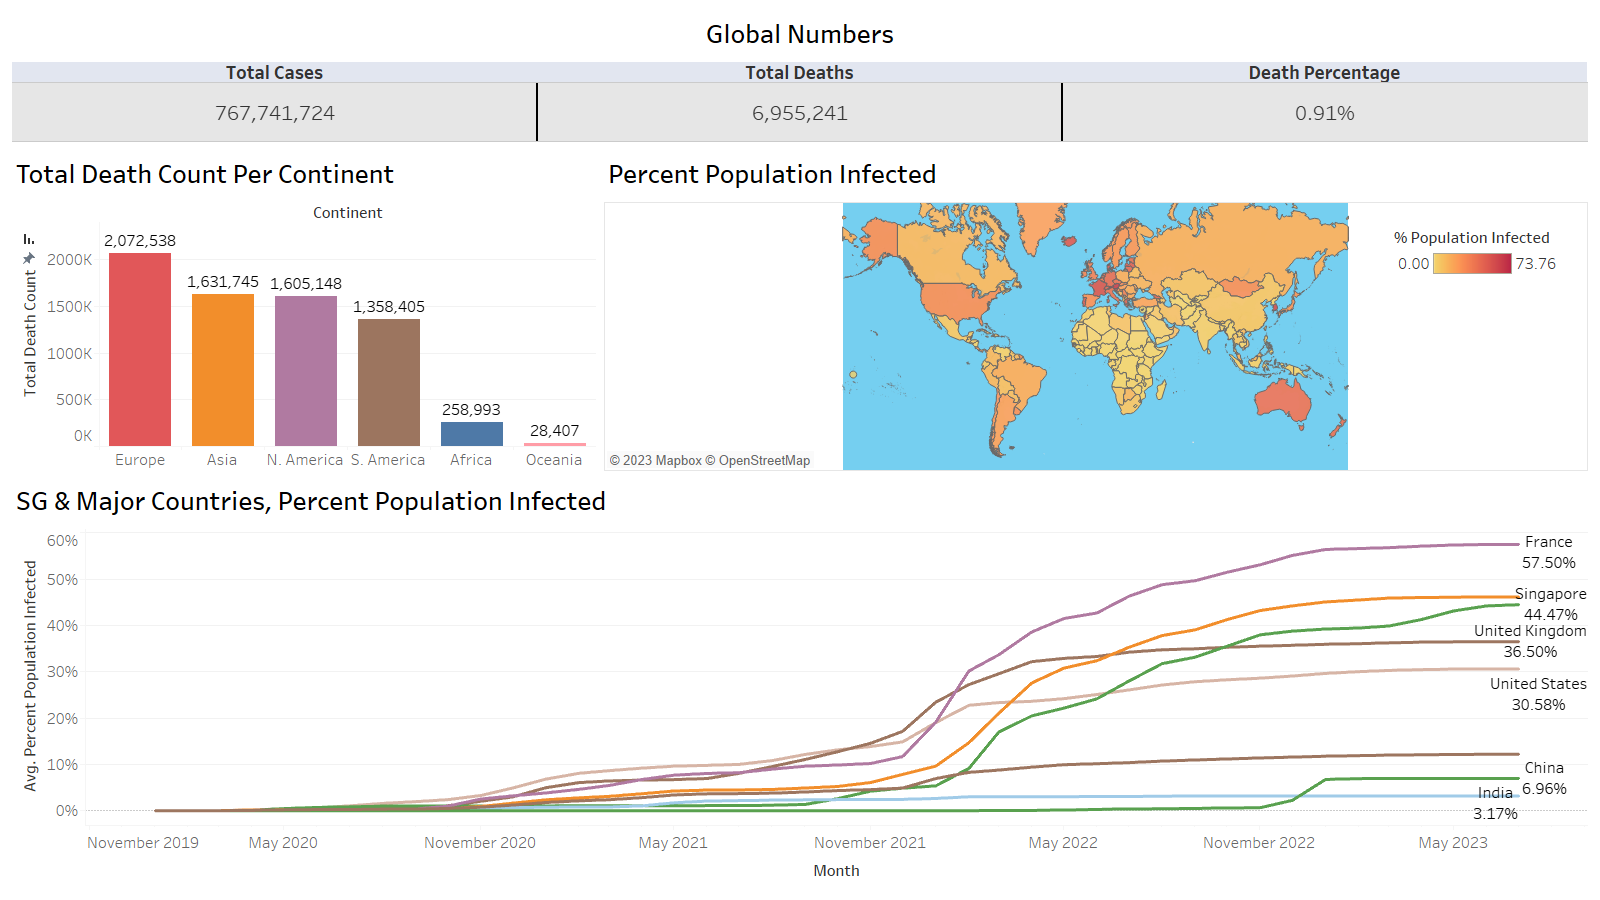
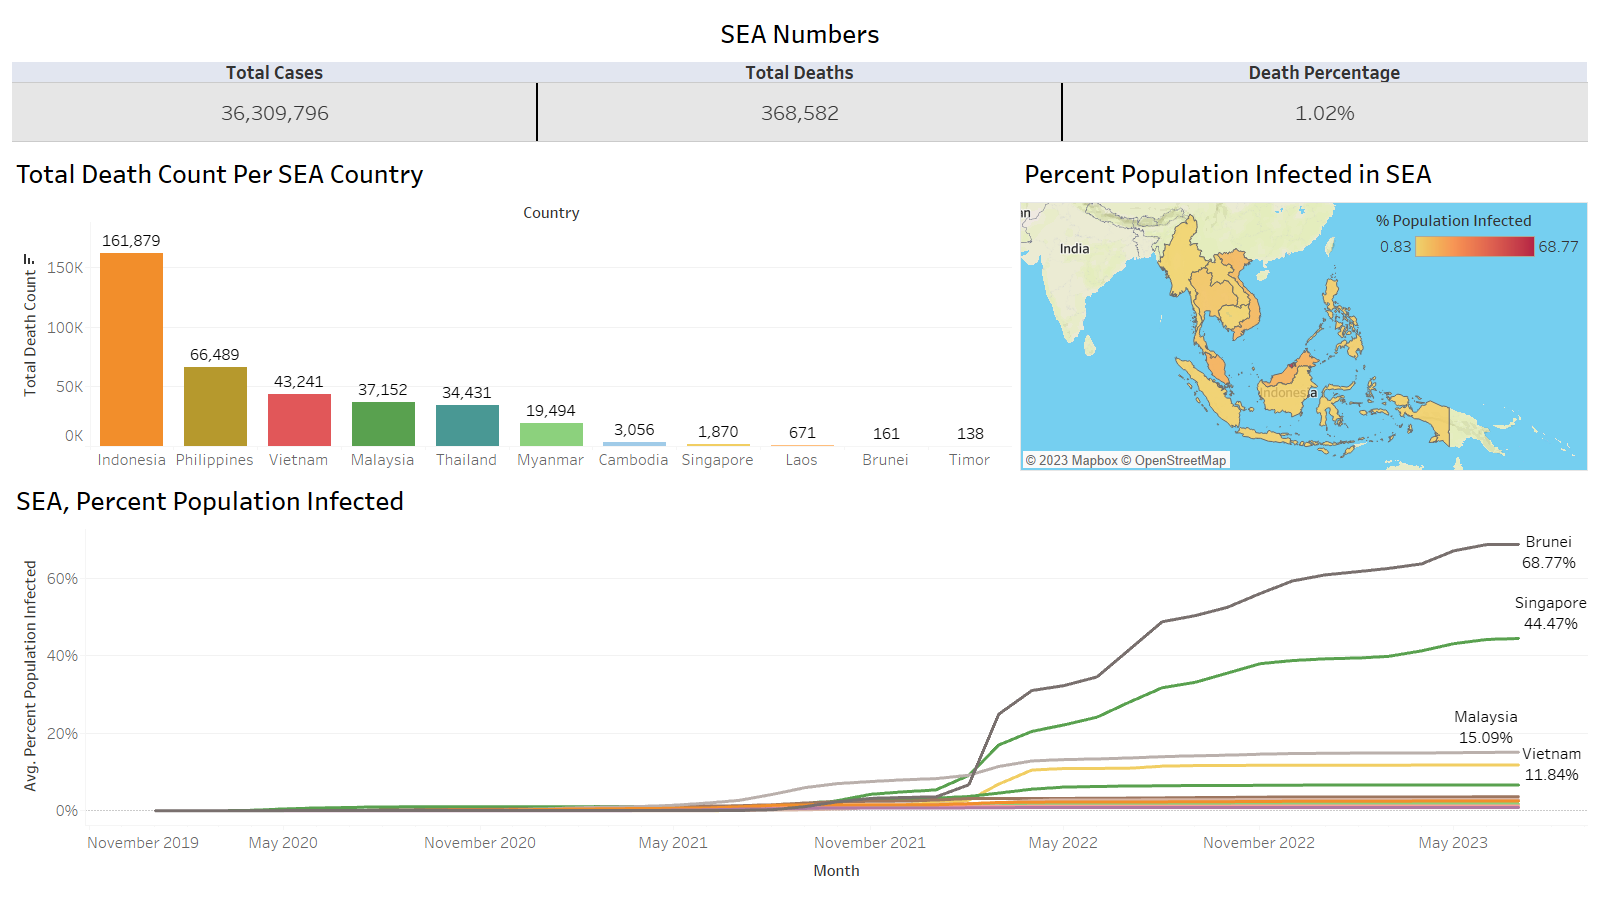
- Global Numbers: A text table showcasing total cases, total deaths and percentage of death present on global scale & within the SEA region.
- Total Death Count per Continent/Country: A horizontal bar chart displaying the total COVID-19 deaths across continents & within the SEA region, facilitating comparison.
- Percent Population Infected: A geographical representation of the percent of population infected by COVID-19 in different countries, allowing for comparative analysis.
- Percent Population Infected: A line chart illustrating the percentage of population infected by COVID-19 across various countries over time, capturing the trajectory of the pandemic.
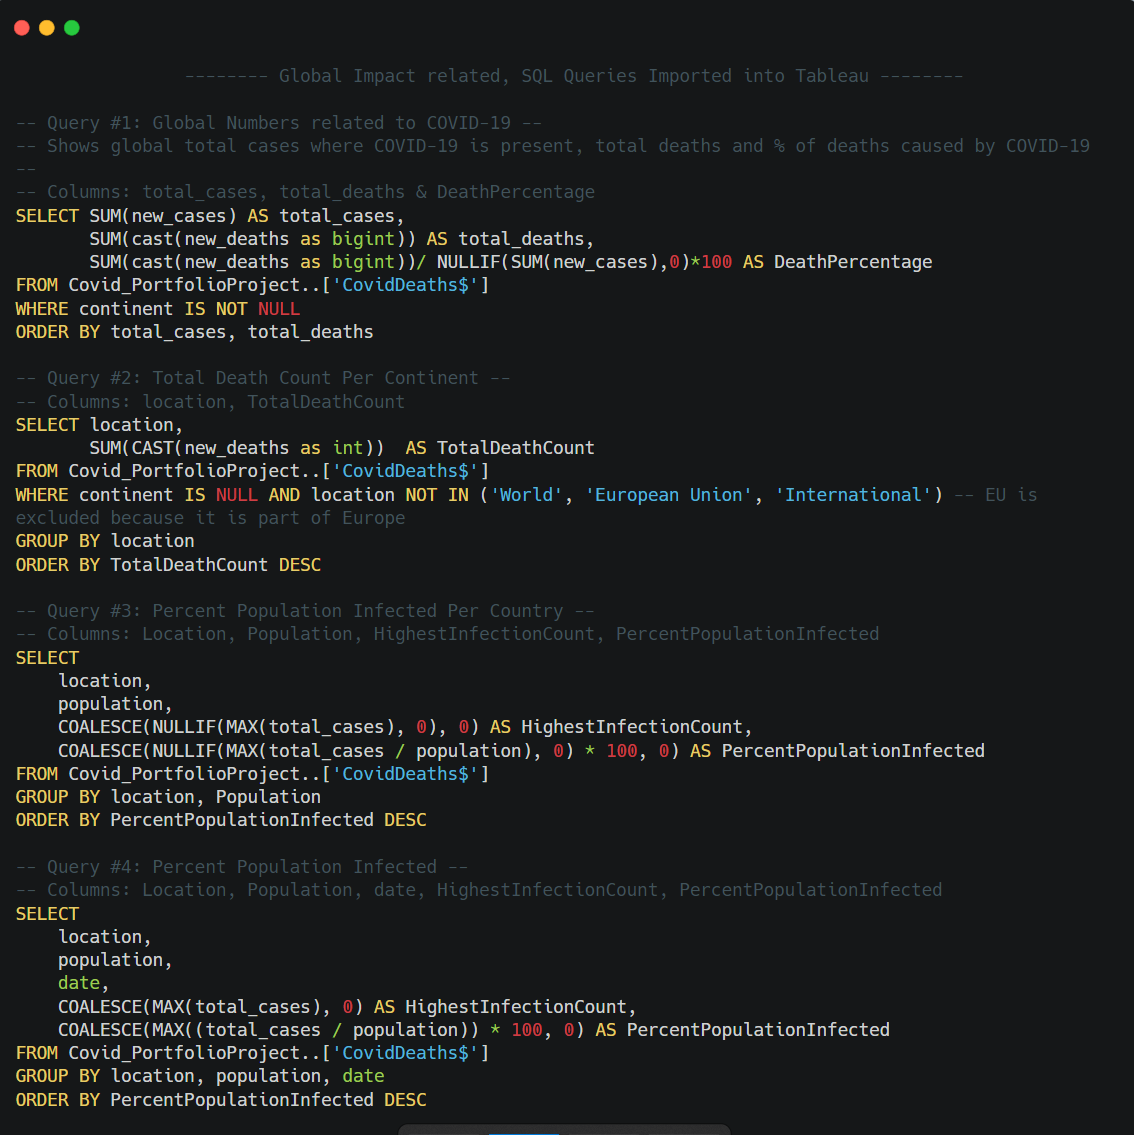
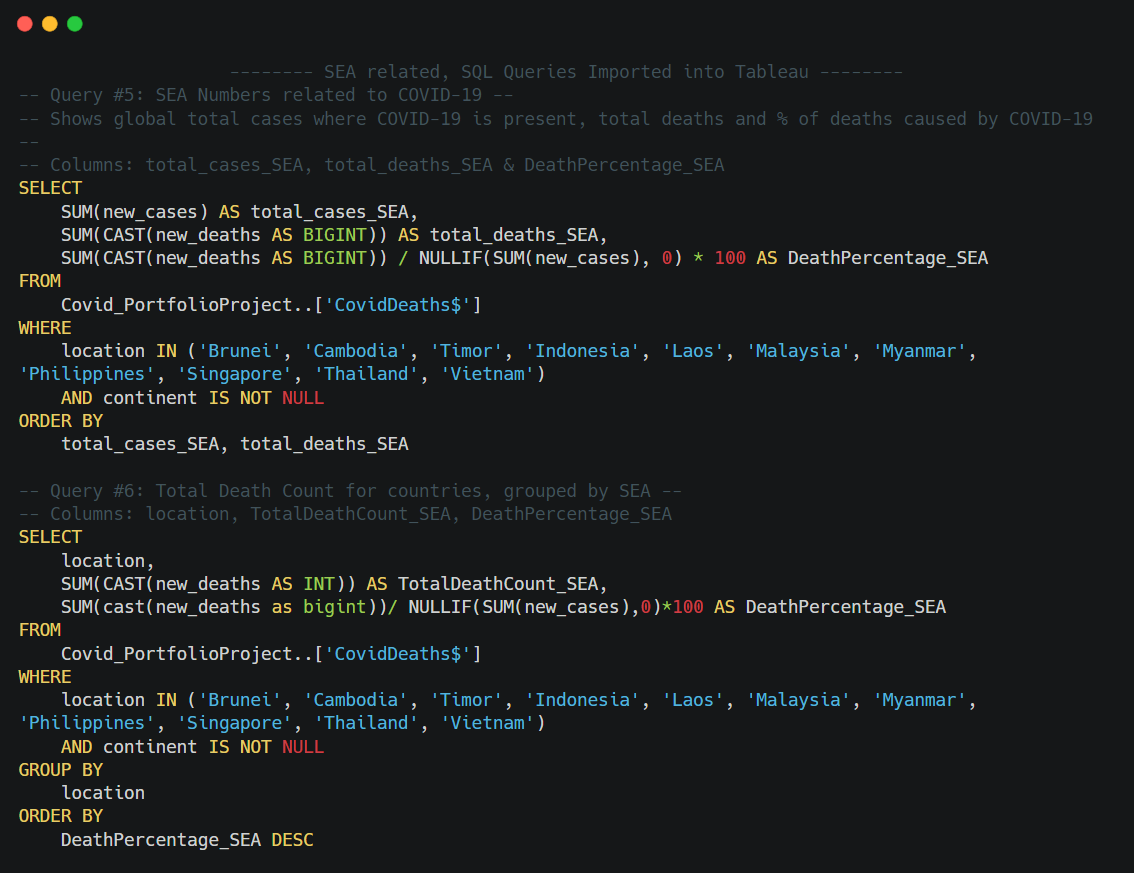
SQL Code Blocks used for Tableau Visualization


Observations
Based on the dataset, From 01/01/2020 to 06/07/2023, we observe that:
On a Global Scale:
- The mortality rate from COVID-19 is about 0.91%
- The continent which have the highest count of deaths in descending order are as follows:
- Europe
- Asia
- North America
- South America
- Africa
- Oceania
Within the SEA region:
- The mortality rate from COVID-19 is about 1.02%
- The country with the highest reported # of COVID-19 related deaths is Indonesia
- Conversely, Singapore is ranked fourth with respect to having the least amount of COVID-19 related deaths in SEA
- This is in spite of it having the 2nd highest percentage of population whom are infected with COVID-19 within the region [~44.47%].
- This may be attributed to Singapore’s robust healthcare system, early intervention measures with strong vaccination campaign, effective contact tracing & public compliance with guidelines. The country’s effective healthcare system and public health communication from authorities have collectively contributed to limiting severe outcomes during the pandemic.
- This is in spite of it having the 2nd highest percentage of population whom are infected with COVID-19 within the region [~44.47%].