Yong Sook Prasit Attavit

MS CS @ Georgia Tech; AI Engineer | Data Scientist | BI Developer
MS CS @ Georgia Tech | AWS Backend Developer | Certified Tableau Desktop Specialist
Technical Skills
- Machine Learning & AI: AWS Sagemaker AI, NLP, LLMs (fine-tuning, prompt engineering, LangChain)
- Frameworks: TensorFlow, PyTorch, Scikit-learn
- Cloud & MLOps: AWS, Databricks, Docker, workflow automation
- Business Intelligence (BI): Python (NumPy, Pandas), SQL, R; TIBCO Spotfire, Tableau, Power BI, AWS QuickSight
- CI/CD & Collaboration: GitHub, JIRA, Confluence, Bitbucket
- Operating Systems: Linux (command-line)
Soft Skills: Project Management, Leadership, Effective Communication & Presentation
Education & Relevant Certifications
- Master of Science - MS, Computer Science: Georgia Institute of Technology, Aug 2024 – Ongoing
- Artificial Intelligence
- Database Systems, Concepts & Design
- Tkinter front-end with MSSQL Backend, LAMP stack application
- Robotics AI Techniques (A* Star, Kalman Filter, Particle Filter, SLAM)
- Machine Learning for Trading (Unsupervised ML)
- DeepLearning.AI: Natural Language Processing with Classification and Vector Spaces (Jan 2024) Link
- TDS-C01: Certified Tableau Desktop Specialist (Jun 2023) Link
- HackerRank SQL [Intermediate] (Jun 2023) Link
- B.S., Chemical Engineering: Technical University of Munich (Sep 2020)
- Dip., Chemical Engineering: Temasek Polytechnic (Apr 2015)
Work Experience
Data Scientist @ National University Health System (Nov 2023 – Present)
- Applied Natural Language Processing (NLP), LLMs, and unstructured free-text feature-engineering with Python to develop supervised machine learning models for cancer prediction
- Designed and deployed TIBCO Spotfire dashboards across multiple departments, enabling real-time clinical insights and operational decision-making.
- Built and deployed machine learning solutions using AWS and Docker, supporting scalable workflows and production-ready AI applications.
- Automated patient triage enrollment and survey responses with FormSG, AWS (Lambda, DynamoDB, S3, etc.), and Twilio—streamlining WhatsApp reminders, secure data ingestion, and developed real-time workload dashboards for clinicians.
Process & Equipment Engineer II @ Micron Semiconductor Operations Asia (Dec 2022 - Feb 2023)
- Continued to hold key appointment role as NPI Module Cycle Time Champion, delivered Module-wide presentation for proposed Diffusion Cycle-Time reduction initiative
- Achieved reduction in NPI Cycle Time from 112 day to 99day for NPI PWE and 97 to 90 days for NPI RAR line to speed up Yield Learning progress for tech node, thus contributing to Fab Yield Ramp as Module Cycle Time Champion
- Successfully achieved a challenging 5.5% Time-To-Mature Cumulative Yield (TTMCY) target by closely monitoring critical inline parameters via macro creation for reporting purposes
- Mentored new hires to improve their fundamental process understanding, problem-solving, and data analysis skills, resulting in their readiness to take up process ownership within 3 months
Process & Equipment Engineer I @ Micron Semiconductor Operations Asia (Dec 2021 - Dec 2022)
- Appointed as NPI Module Cycle Time Champion, which involved managing & communicating with various Process Owners to drive down 4 pillars of Cycle Time to acheive NPI manufacturing KPI target
- Coordinated and enabled 2.5x capability on shared Workstation and achieved fab-target of 0 single-tool availability while serving as NPI Cycle Time Champion for Diffusion and Implant module
- Managed 5 NPI projects related to RTP, DPN & Poly processes relating to recipe improvement, FOAK tool qualification and photo scanner reject issue thus resulting in a cumulative 1.5% Yield Gain, 6% Manufacturing Availability improvement, 28% Recipe Processing Time Reduction and 50% improvement in photo scanner lot rejection per annum
- Presented weekly analysis, plots, results, suggestions and directions to senior management and cross-faculty team members
Manufacturing Engineer @ Systems on Silicon Manufacturing Company Pte Ltd (SSMC) (Jan 2021 – Jul 2021)
- Led root-cause investigation through data mining efforts for wafer scrap case and presented investigation findings to senior management. Implemented SOP to prevent future occurrences of wafer scrap resulting from identified root cause
- Collaborated with Automation Engineers in the development of SQL/VBA Excel Sheet for hourly Run, Queue, Hold WIP tracking system to identify and rectify production bottlenecks
- Coordinated production activities with manufacturing technicians, process, equipment, automation and industrial engineers to meet daily and monthly manufacturing goals through the efficient use of manpower, material, and machine
Personal Projects
Dog Rescue Management System [Local Full Stack Application: Python, Tkinter, MySQL Connector]
Developed a multi-window desktop application using Tkinter to streamline operations for a dog rescue shelter, including volunteer management, dog intake, and adoption processing.
Engineered a data pipeline to initialize and populate a MySQL database by parsing data from multiple .tsv files and executing schema creation scripts.
Implemented full CRUD (Create, Read, Update, Delete) functionality, connecting the GUI to the database backend to manage records for dogs, adopters, applications, and expenses.
Designed and coded complex business logic, such as a system for dynamically calculating adoption fees based on a dog’s history and expenses logged in the database.
Loan Defaulter Machine Learning Classification [Python, scikit-learn, Applied Machine Learning]
Business Case: Develop a Machine Learning model for the company to identify if the loan applicant is likely or unlikely to default on the loan, thereby assisting in the company’s portfolio & risk assessment capabilities
Exploratory Data Analysis [EDA], feature-engineering & model testing was conducted using Python within the JupyterNotebook environment. Various feature engineering techniques & models were experimented & the best AUC scoring model was then selected & applied to form the final model.
The final model, along with the feature-engineered dataframe, acheived a ~90% predictive AUC score after cross-validation via the Kaggle platform, thus demonstrating a strong ablity to discriminate between loan applicants whom are likely or unlikely to default on loans.
.png)
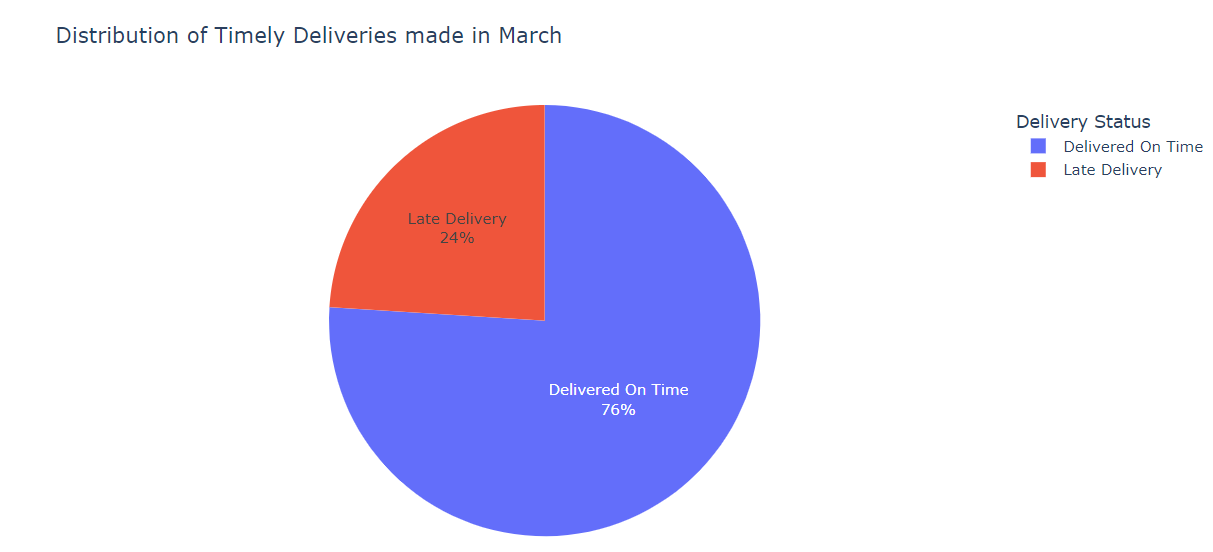
Shopee Code League: Logistics [Python]
Background: Amidst the global COVID-19 pandemic, the surge in online orders on Shopee has heightened the importance of on-time delivery, a critical factor in e-commerce success. To meet this demand, Shopee has partnered with top-performing logistics providers across the region, enforcing SLAs and penalties to ensure timely deliveries. This rigorous monitoring and accountability process reinforces Shopee’s commitment to delivering goods punctually, enhancing user confidence.
Task: Identify all the orders that are considered late depending on the Service Level Agreements (SLA) with Shopee’s Logistics Provider.
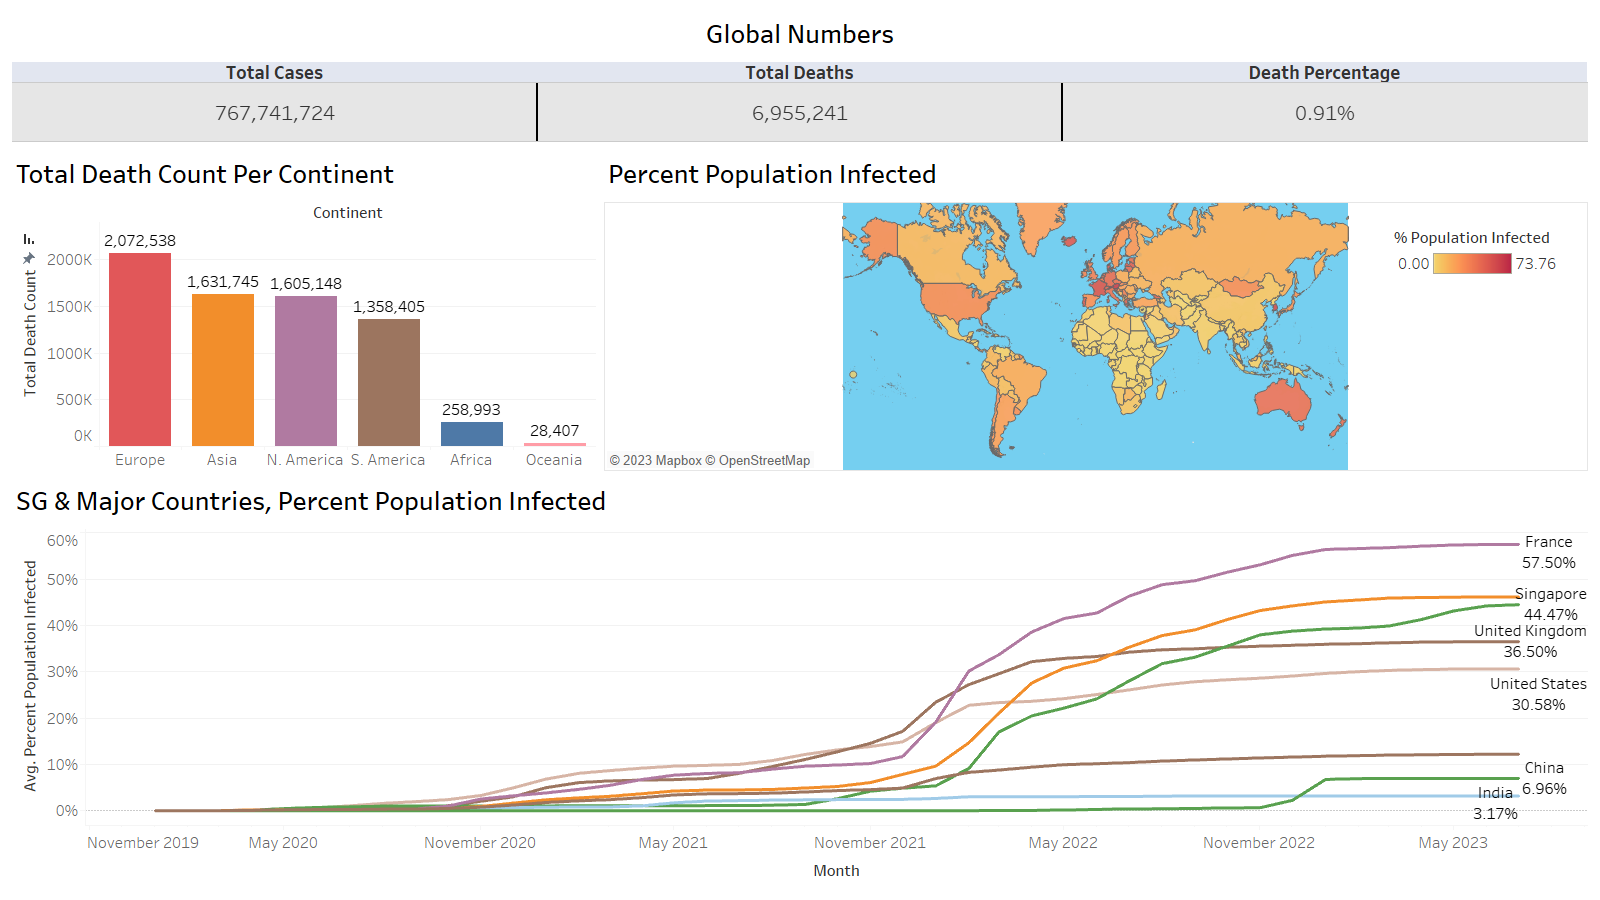
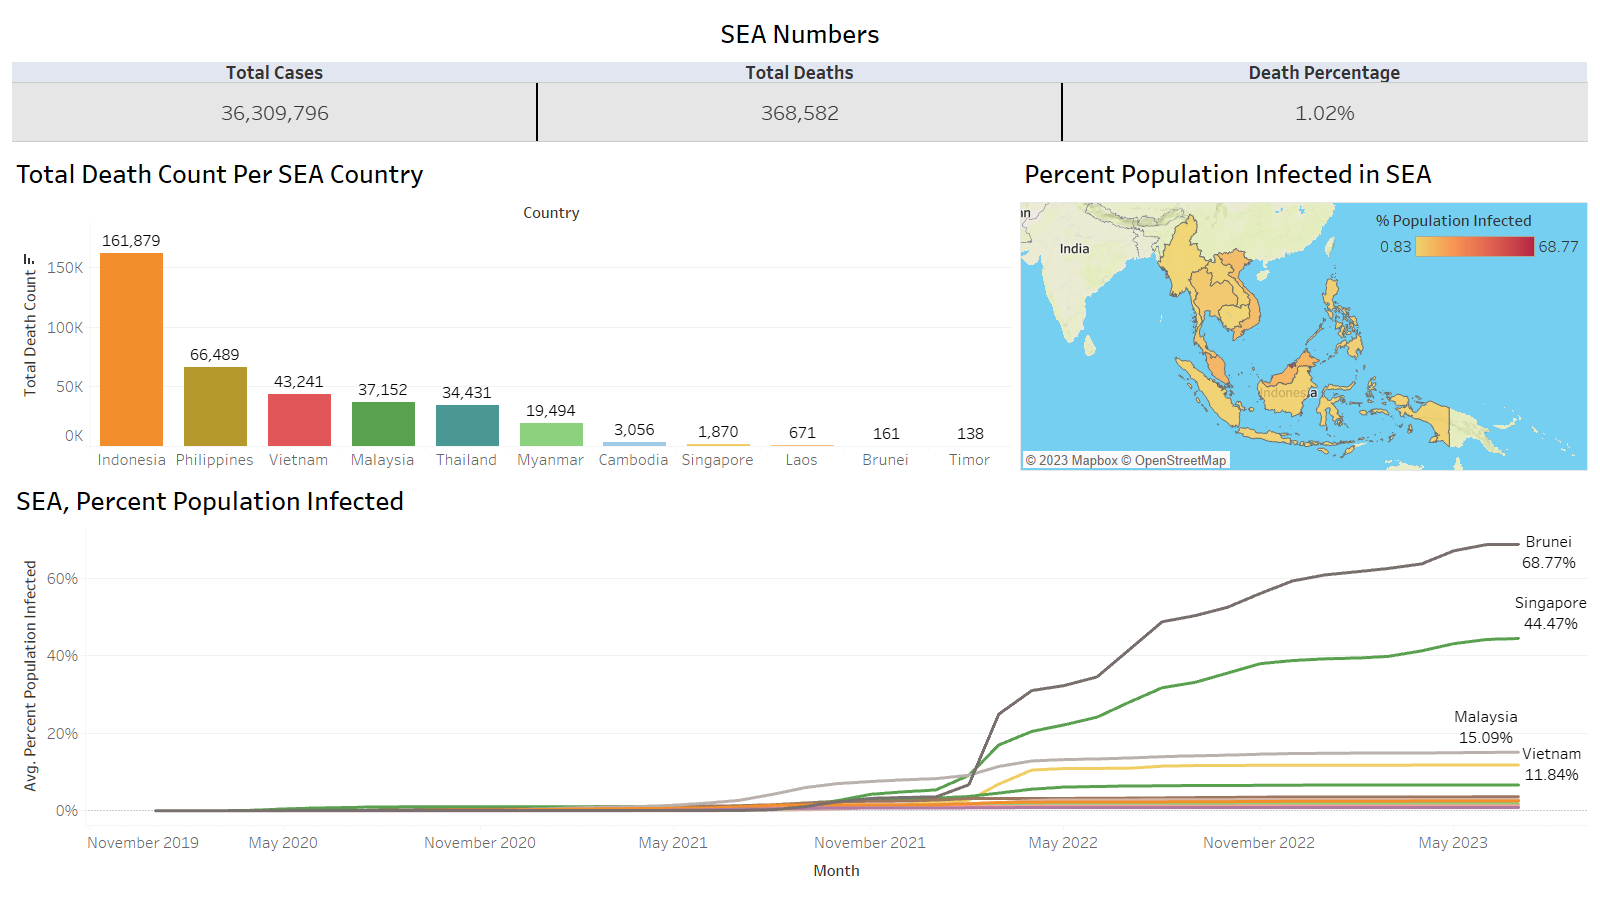
COVID-19_SQL_Tableau_Dashboard [T-SQL, SQL Server Management Studio, Tableau]
Background: This project focuses on visualizing COVID-19 infection and deaths using data obtained from ‘Our World in Data’ with Tableau. It aims to provide a visual representation of the detrimental impact of COVID-19 on a global scale & within the SEA region.
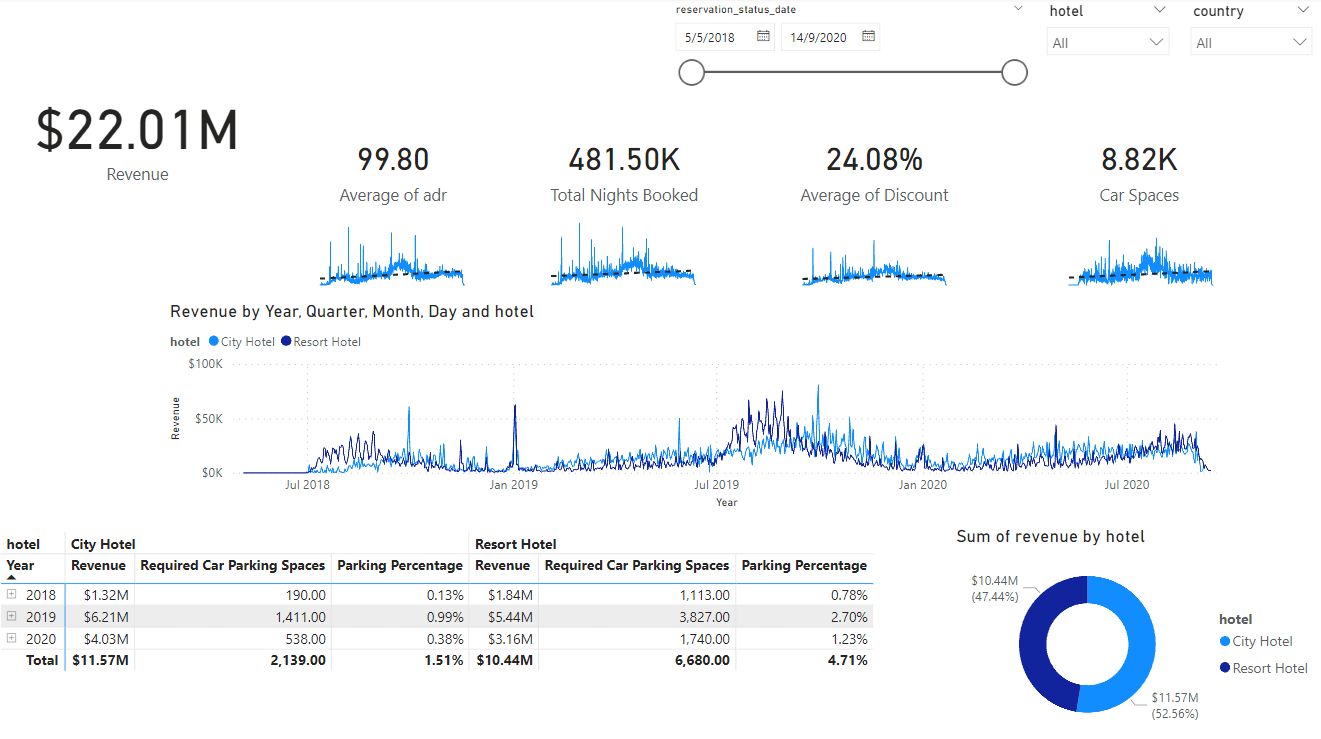
Hotel Revenue Analysis [PowerBI, PowerQuery M, T-SQL, SQL Server Management Studio, Excel, PowerPoint]
Business Case: A business manager of a chain of hotel would like to request help from the data analytics team to develop a dashboard to analyze & visualize hotel booking data
- The business manager is interested if there’s any patterns/ seasonality with respect to:
1) Guests
2) Revenue
Requirement: Build a Dashboard using PowerBI to provide at-a-glance information about features that are relevant to revenue
Data from raw .csv file was ingested into SQL Server Management Studio [SSMS], from which SQL queries were iteratively built upon to obtain the final output which was then imported into SSMS for data analysis & visualization. Additional data processing was done in PowerBI with PowerQuery M for visualization purposes.
Guests, revenue seasonality, recommendation for staffing arrangement, and dataset limitations were explained with the help of additional visualizations done in PowerBI in the accompanying Powerpoint slides.
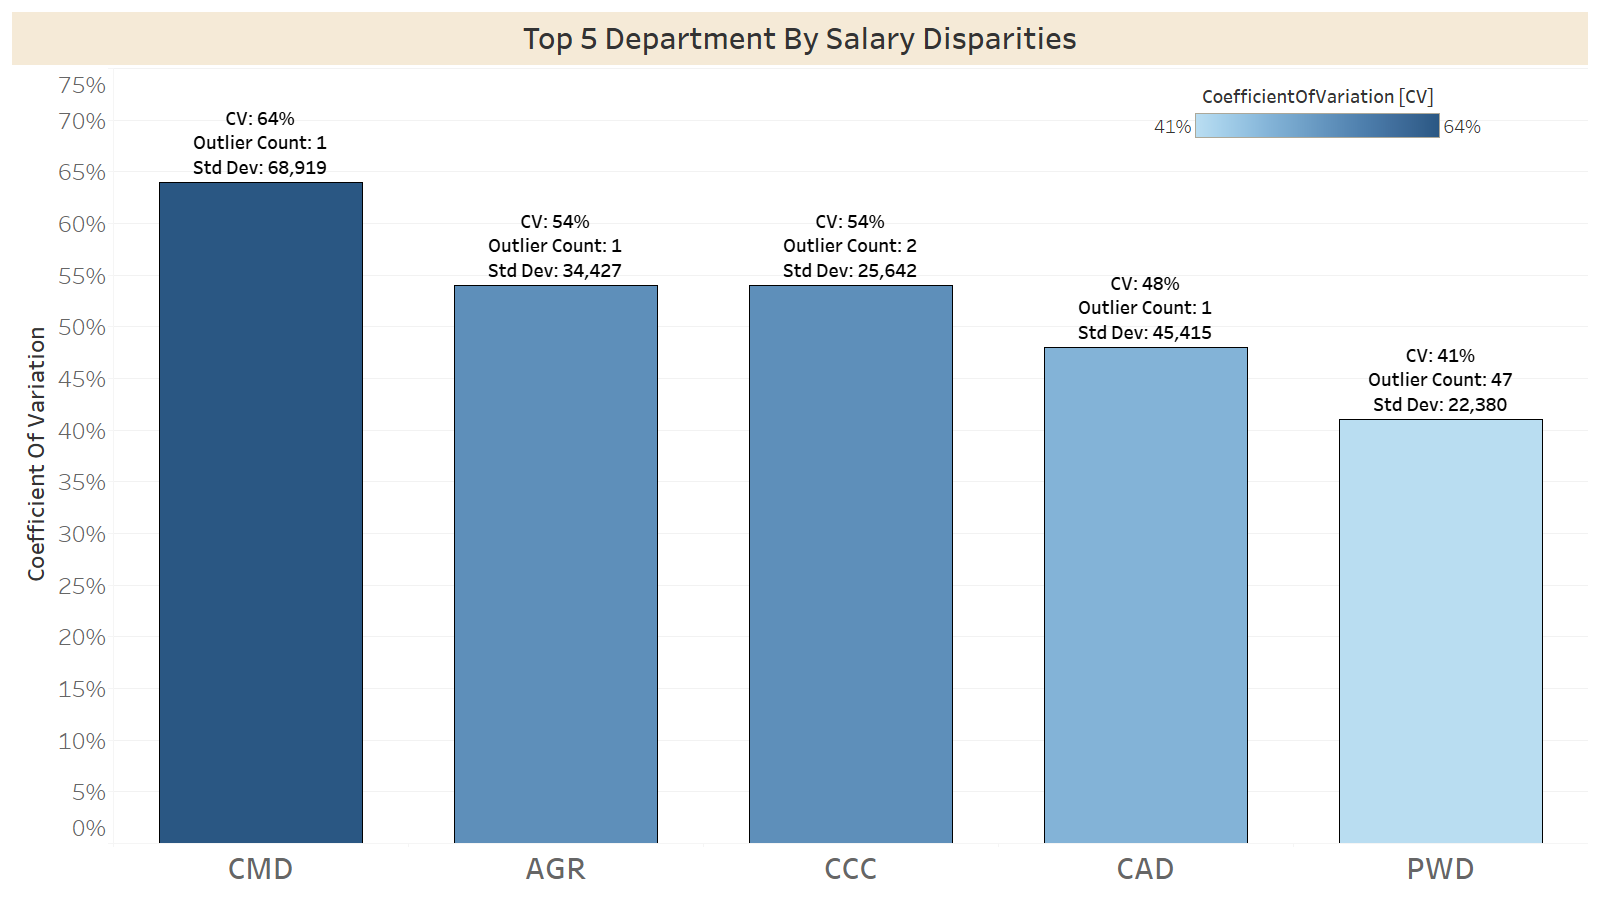
Analysis of Departmental Salary Disparities [Tableau, Python, T-SQL, SQL Server Management Studio, Excel, Powerpoint]
Business Case: The data analytics manager of a company would like to seek insights into salary disparities present within the company department
Objective:
- Obtain relevant insights with Exploratory Data Analysis (EDA), and create a SQL query that identifies a high amount of variation within the department
- Provide the top 5 department that should be selected for management to review, with regards to having the most variance & discrepancy in salary
Deliverables:
- Provide a list from a SQL database with a way to score variation by Department
- JupyterNotebook with accompanying Python code block for SQL calculation cross-validation & EDA
Data from raw .csv file was ingested into SQL Server Management Studio [SSMS], from which SQL queries were iteratively built upon to obtain the final output which included the departmental:
- Standard Deviation
- Average Salary
- Coefficient Of Variation
- Outlier Count based off Z-Score values
The top 5 departments (along with reasons for selection) were flagged out for review, based on the calculated output. Further elaboration is done in the accompanying JupyterNotebook and Powerpoint Slides.
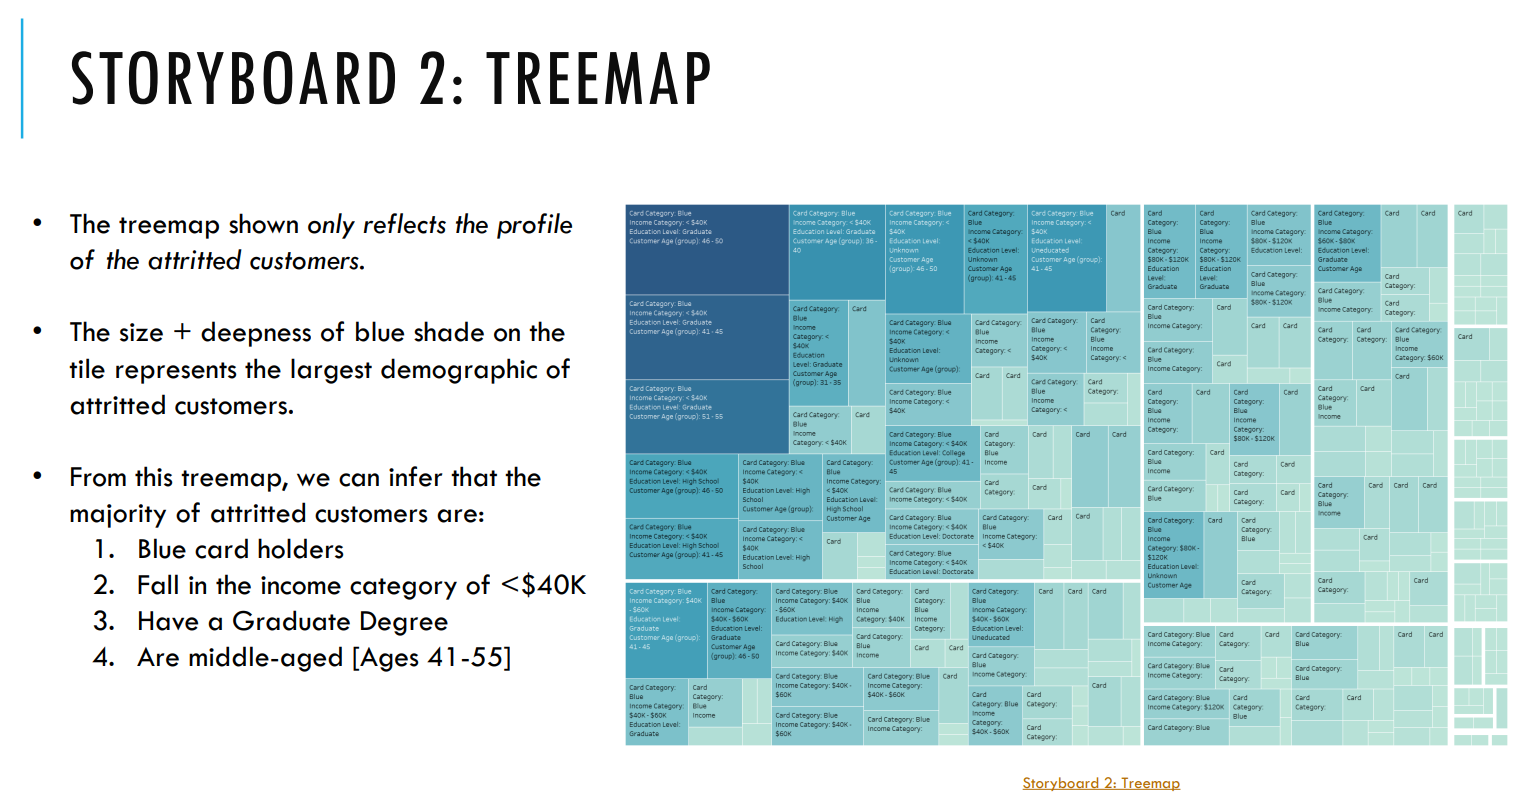
Analysis of Credit Card Churning Customers [Tableau, Powerpoint]
Analysis of attritted bank customers were performed based on various qualitative & quantitative measures using Tableau for data visualization.
Relevant recommendations that the bank can undertake to alleviate churning customers were proposed. Limitations of the dataset which may lead to analytics bias was also discussed. Further elaboration is done in the accompanying Powerpoint Slides.
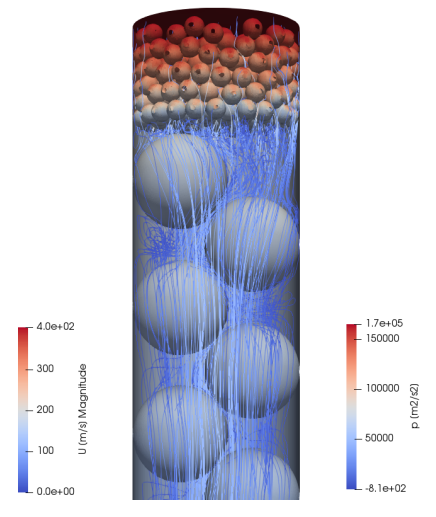
Numerical Investigation of Pressure Drop at Turbulent Flow Conditions in Single Pellet String Reactors [Computational Fluid Dynamics, LaTeX, OpenFOAM®, ParaView, Linux, C++]
Achieved distinction for thesis.
Application: C++ Programming was used in conjunction with OpenFOAM® in a Linux Distribution [Ubuntu] where modeling, mesh generation, and turbulent fluid simulations was conducted.
ParaView is used as both the GUI and post-processing tool to extract pressure drop, along with other parameters of interest. LaTeX was used for relevant graph plotting and the aggregation of all findings into a presentable format.
Courses
- DeepLearning.AI: Natural Language Processing with Classification and Vector Spaces
- Heicoders Academy AI200: Applied Machine Learning
- Udemy, The Complete SQL Bootcamp: Go from Zero to Hero
- LinkedIn Learning SQL Essential Training
- Hackwagon IBF-DS101: Data Science 101 Bootcamp
- Vertical Institute: IBF-Data Analytics Bootcamp
- DataCamp:
▪ Data Visualization in PowerBI
▪ Intermediate Python
▪ Intermediate SQL - Google Data Analytics Professional Certificate: Data Analysis with R Programming
- University of California (Coursera): Project Management Principles and Practices
- University System of Georgia (Coursera): Six Sigma Yellow Belt
- Coursera Project Network: Creating an Interactive KPI Management Dashboard in Tableau
- University of Colorado (Coursera): Excel/VBA for Creative Problem Solving